Debugging timeouts on Heroku

In August 2018, I wrote about the challenges of moving from AWS to Heroku. A new challenge has presented itself on the same website since then: a large number of request timeouts at unpredictable times during the day.
What we saw in Heroku
For the last few months, we’ve regularly had days where the Heroku metrics would look like this:
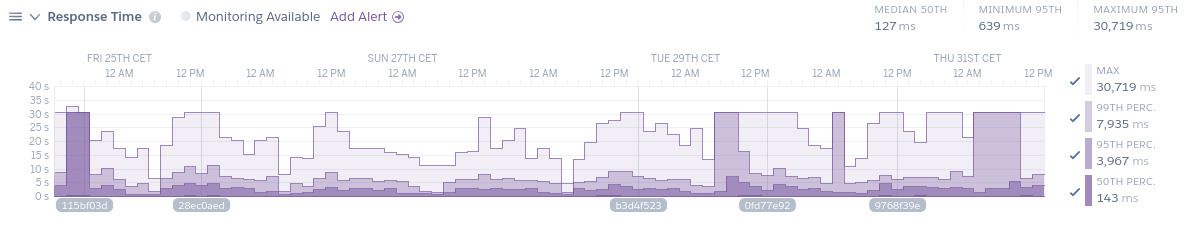
What we can see here is that lots of requests take between 8 and 30 seconds, with 30 seconds being the maximum request timeout for Heroku.
These timeouts appeared completely unpredictably. Rebooting the database server and application servers would fix the issue for a few days, before the same things happened again. And again. And again.
Our first thought was that some requests were very slow and were probably clogging up the database server, until eventually, it would be overloaded. So we started looking at which requests initiated the timeouts, first with the good old heroku logs command from the Heroku CLI.
But that wasn’t it. And PHP logs didn’t reveal anything useful either. So we looked at our database metrics in the AWS RDS dashboard.
What we saw in AWS RDS metrics
We didn’t necessarily know what to look for in database metrics because we hadn’t had any database performance issues up until then.
What we could see for sure was that when the website crashed, the number of simultaneous database connections was very high. And read IOPS were also very high.
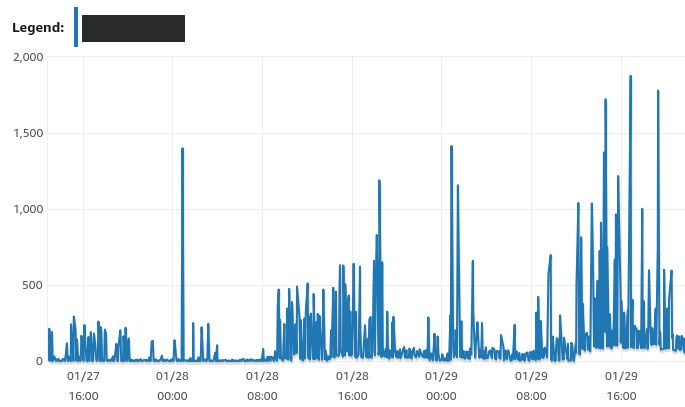
Read IOPS in AWS metrics
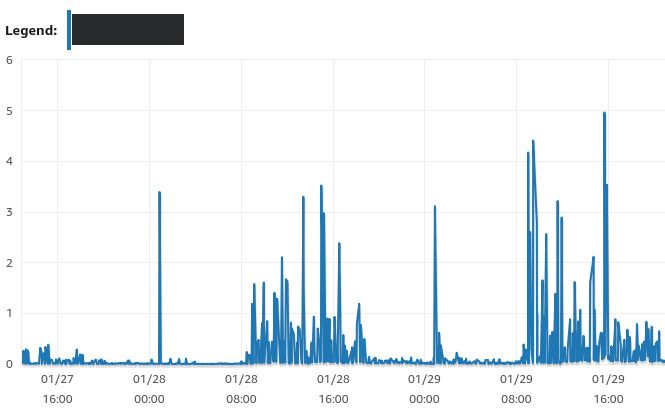
Queue depth in AWS metrics
We didn’t know why, though. And we didn’t know where else to look to get better insights. After talking with some developers outside the company, we realized we needed more logs. So here comes ELK.
Adding an ELK stack into the mix
We setup an ELK (Elastic Search, Logstash, Kibana) and sent it all the logs we could possibly get (Heroku, Nginx, PHP, MariaDB, etc).
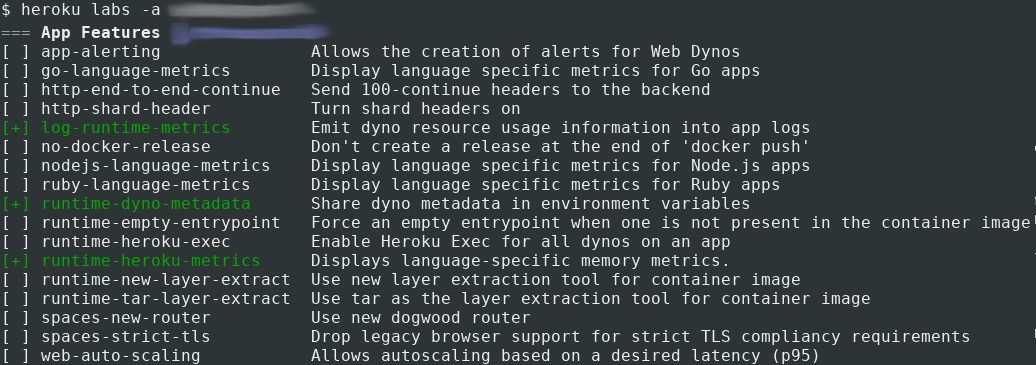
We made sure to import Heroku server metrics through Heroku Labs. The useful features in our case were log-runtime-metrics, runtime-dyno-metadata and runtime-heroku-metrics, which would give us access to CPU and RAM usage metrics.
ELK is great in that it allows us to search for something in all logs at once, without having to be too specific about what we’re looking for. Heroku timeouts can be searched with the type:heroku AND at:error query:
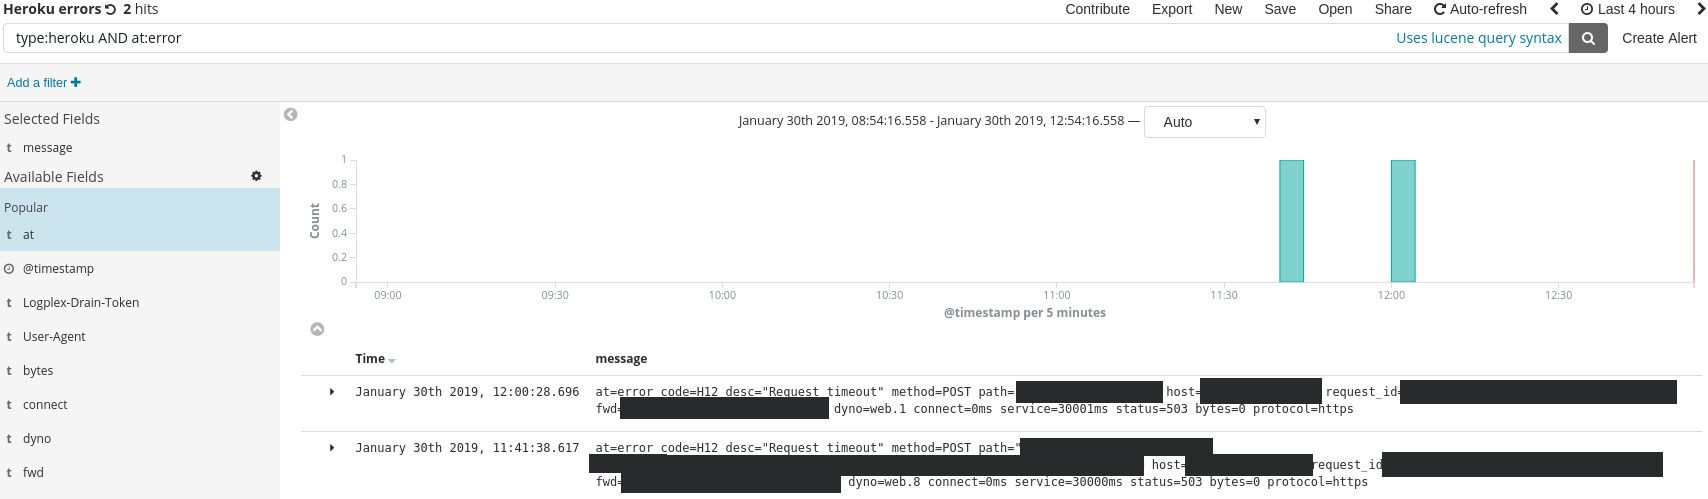
Once we got ELK setup, we waited until the timeouts reappeared, hoping we would finally figure out what was going on.
But when the timeouts reappeared, we didn’t still were unable to figure out what their root cause was. The logs confirmed that SQL requests were taking a long time to complete, but didn’t tell us why the requests were suddenly slow.
However, these new logs helped to rule out what the problem was not:
- metrics from Heroku Labs features confirmed that there was no application server overload;
- through custom data parsing and graphs in ELK, we could see that our background jobs were not the issue either, as there was nothing odd going on in times of high request timeout rate;
- there was no significant increase in traffic during high request timeout rate, which indicated we were not getting spammed by malicious 3rd parties.
Given all that, it was time to dig deeper into the database server configuration and metrics.
AWS RDS default configuration
Diving back into the MariaDB documentation and the AWS configuration, we noticed that some of MariaDB's default timeouts were unsuitable to use with Heroku’s 30 second timeout.
For instance, the max_statement_time configuration value was set to use the “engine default”. MariaDB disables max_statement_time by default. So we set it to 25 seconds, which is more than enough.
We cycled through some other settings and ended up with this updated configuration:
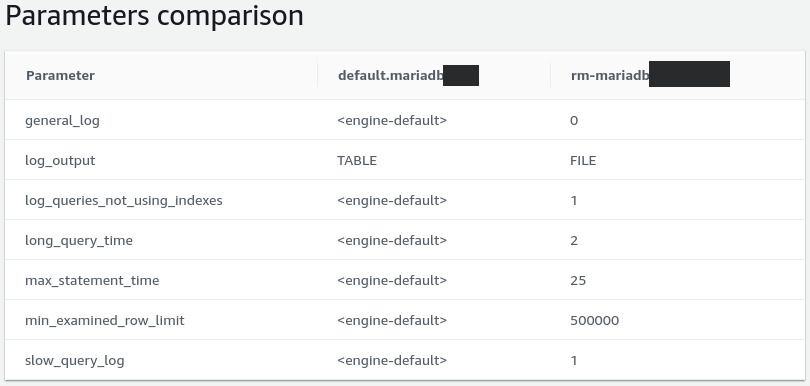
Default MariaDB configuration (left) and updated configuration (right)
AWS RDS best practices
While the updated configuration gave us clearer error messages in logs, the instability was still very much present, so we had a closer look at the AWS RDS manuals and we stumbled onto the AWS RDS best practices:
An Amazon RDS performance best practice is to allocate enough RAM so that your working set resides almost completely in memory. To tell if your working set is almost all in memory, check the ReadIOPS metric (using Amazon CloudWatch) while the DB instance is under load. The value of ReadIOPS should be small and stable.
We had a look at the metrics again and saw this:
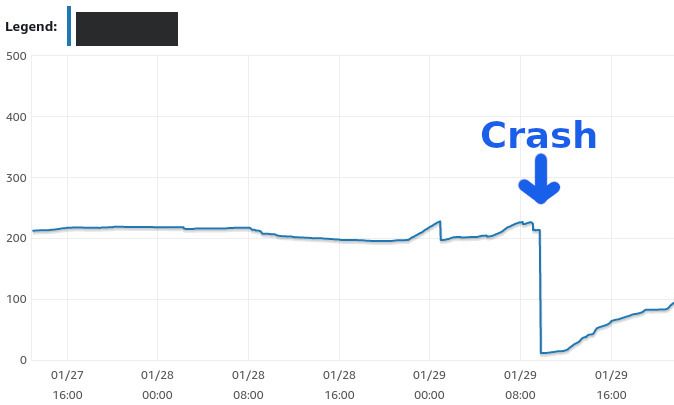
Swap in AWS metrics
In addition, as seen above, we had very unstable read IOPS. Now things started to light up. The problem suddenly seemed simple: our database server was not powerful enough, it didn’t have enough RAM.
So we upgraded the AWS RDS instances.
That was it:
- IOPS are low and stable;
- SWAP is 0Mb and stable;
- random crashes with high SQL times are gone.
Everything seems so obvious after the fact. We could have just upgraded the server from the start. Adding more servers is a commonly used solution after all. But then again, it’s not always scalable to “just add more hardware”. More importantly, it doesn’t fix the underlying issue in all cases.
In this case it does though. Going through the process of trying to understand what the problem was before adding the hardware means we understand IOPS and SWAP metrics. We now monitor them proactively.